
Executable fills
Every Orca portfolio is priced twice: once at the prices the whale got, and once at the prices you could actually have gotten. The toggle above the chart switches between them, and the gap between the two is usually the most useful number on the page.
The question it answers#
Filling every copied trade at the whale's own price, instantly and in unlimited size, is not a simulation of copying them. It is a restatement of their P&L. A copier arrives after the whale, as a taker, into a book the whale has already moved.
The executable view asks the narrower question instead: given the trades that actually printed on this market after the whale's fill, what could a copier have gotten?
How the price is reconstructed#
Polymarket publishes a market's full historical tape, so for any past trade the prints that followed it are knowable in a way an order book is not. Orca reads that tape from just after the whale's fill and builds a ladder of reachable prices, each recorded as an offset in seconds rather than a fixed price, so the same stored ladder can answer both "we check every minute" and "we watch continuously".
The whale's own liquidity is excluded, matched by transaction rather than by wallet. The tape carries one row per transaction from the taker's side, so a whale leg shows up either as its own row or under whoever lifted it, and keying on the wallet alone would miss half of them.
Ideal versus Executable#
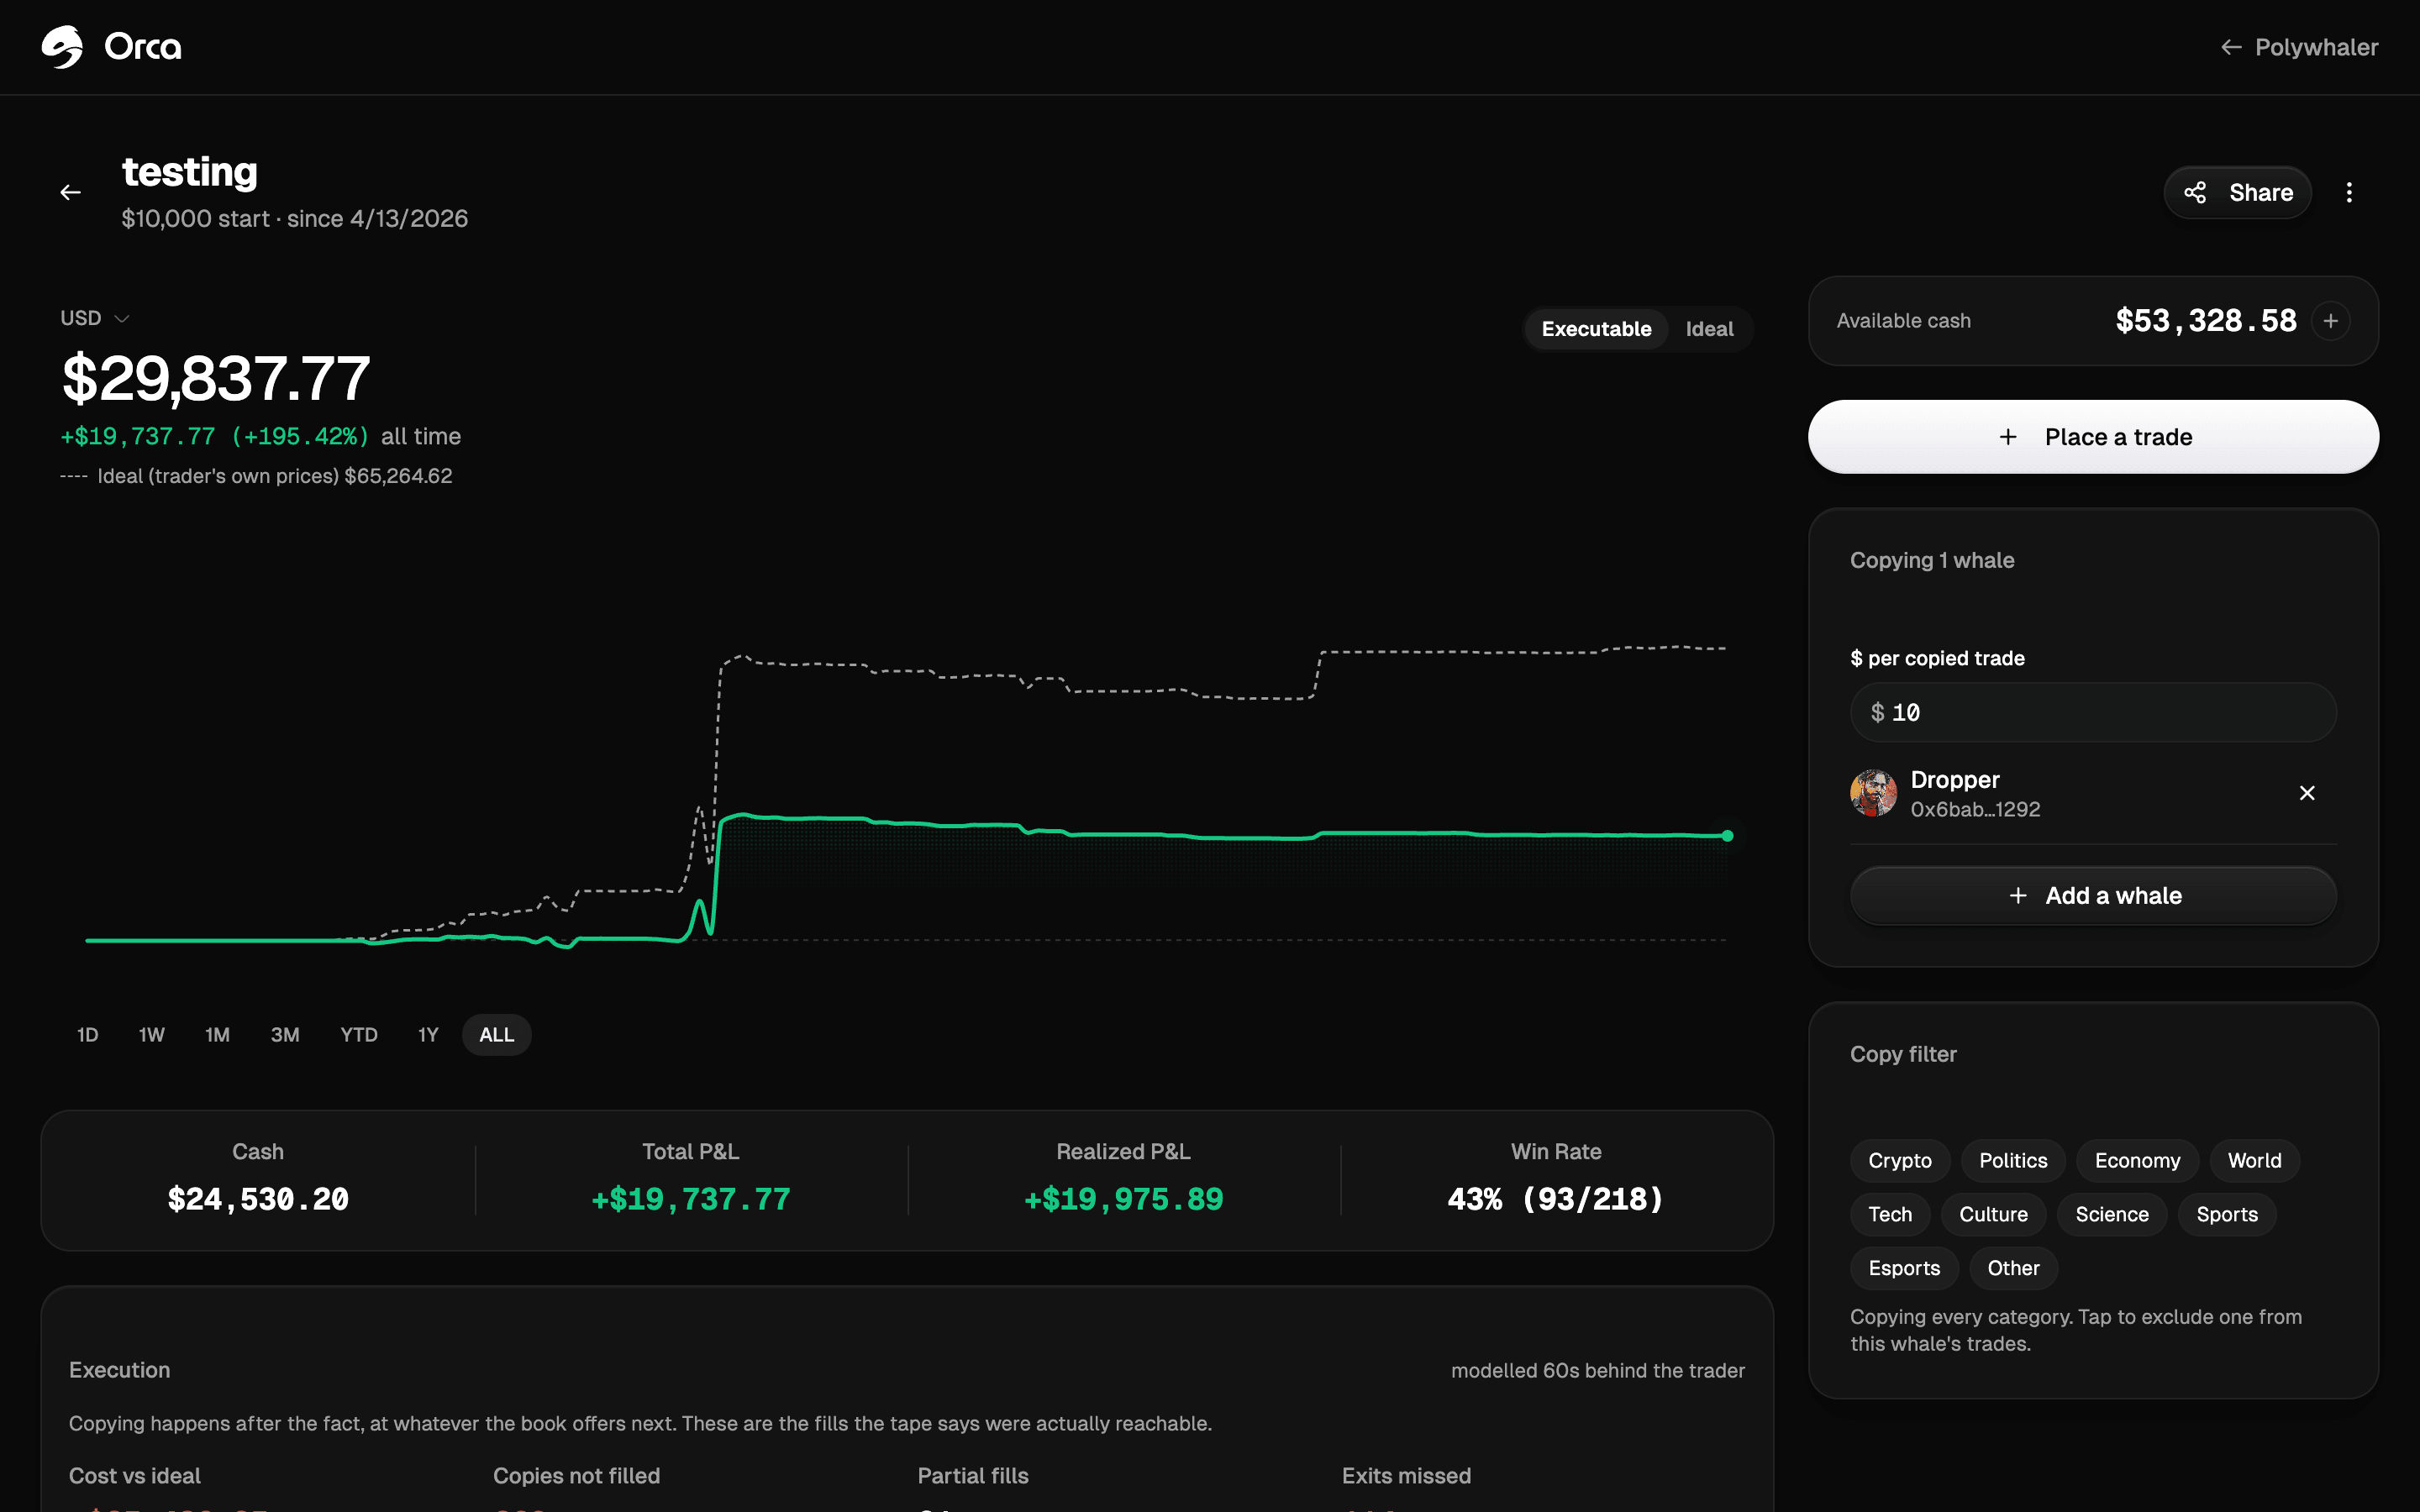
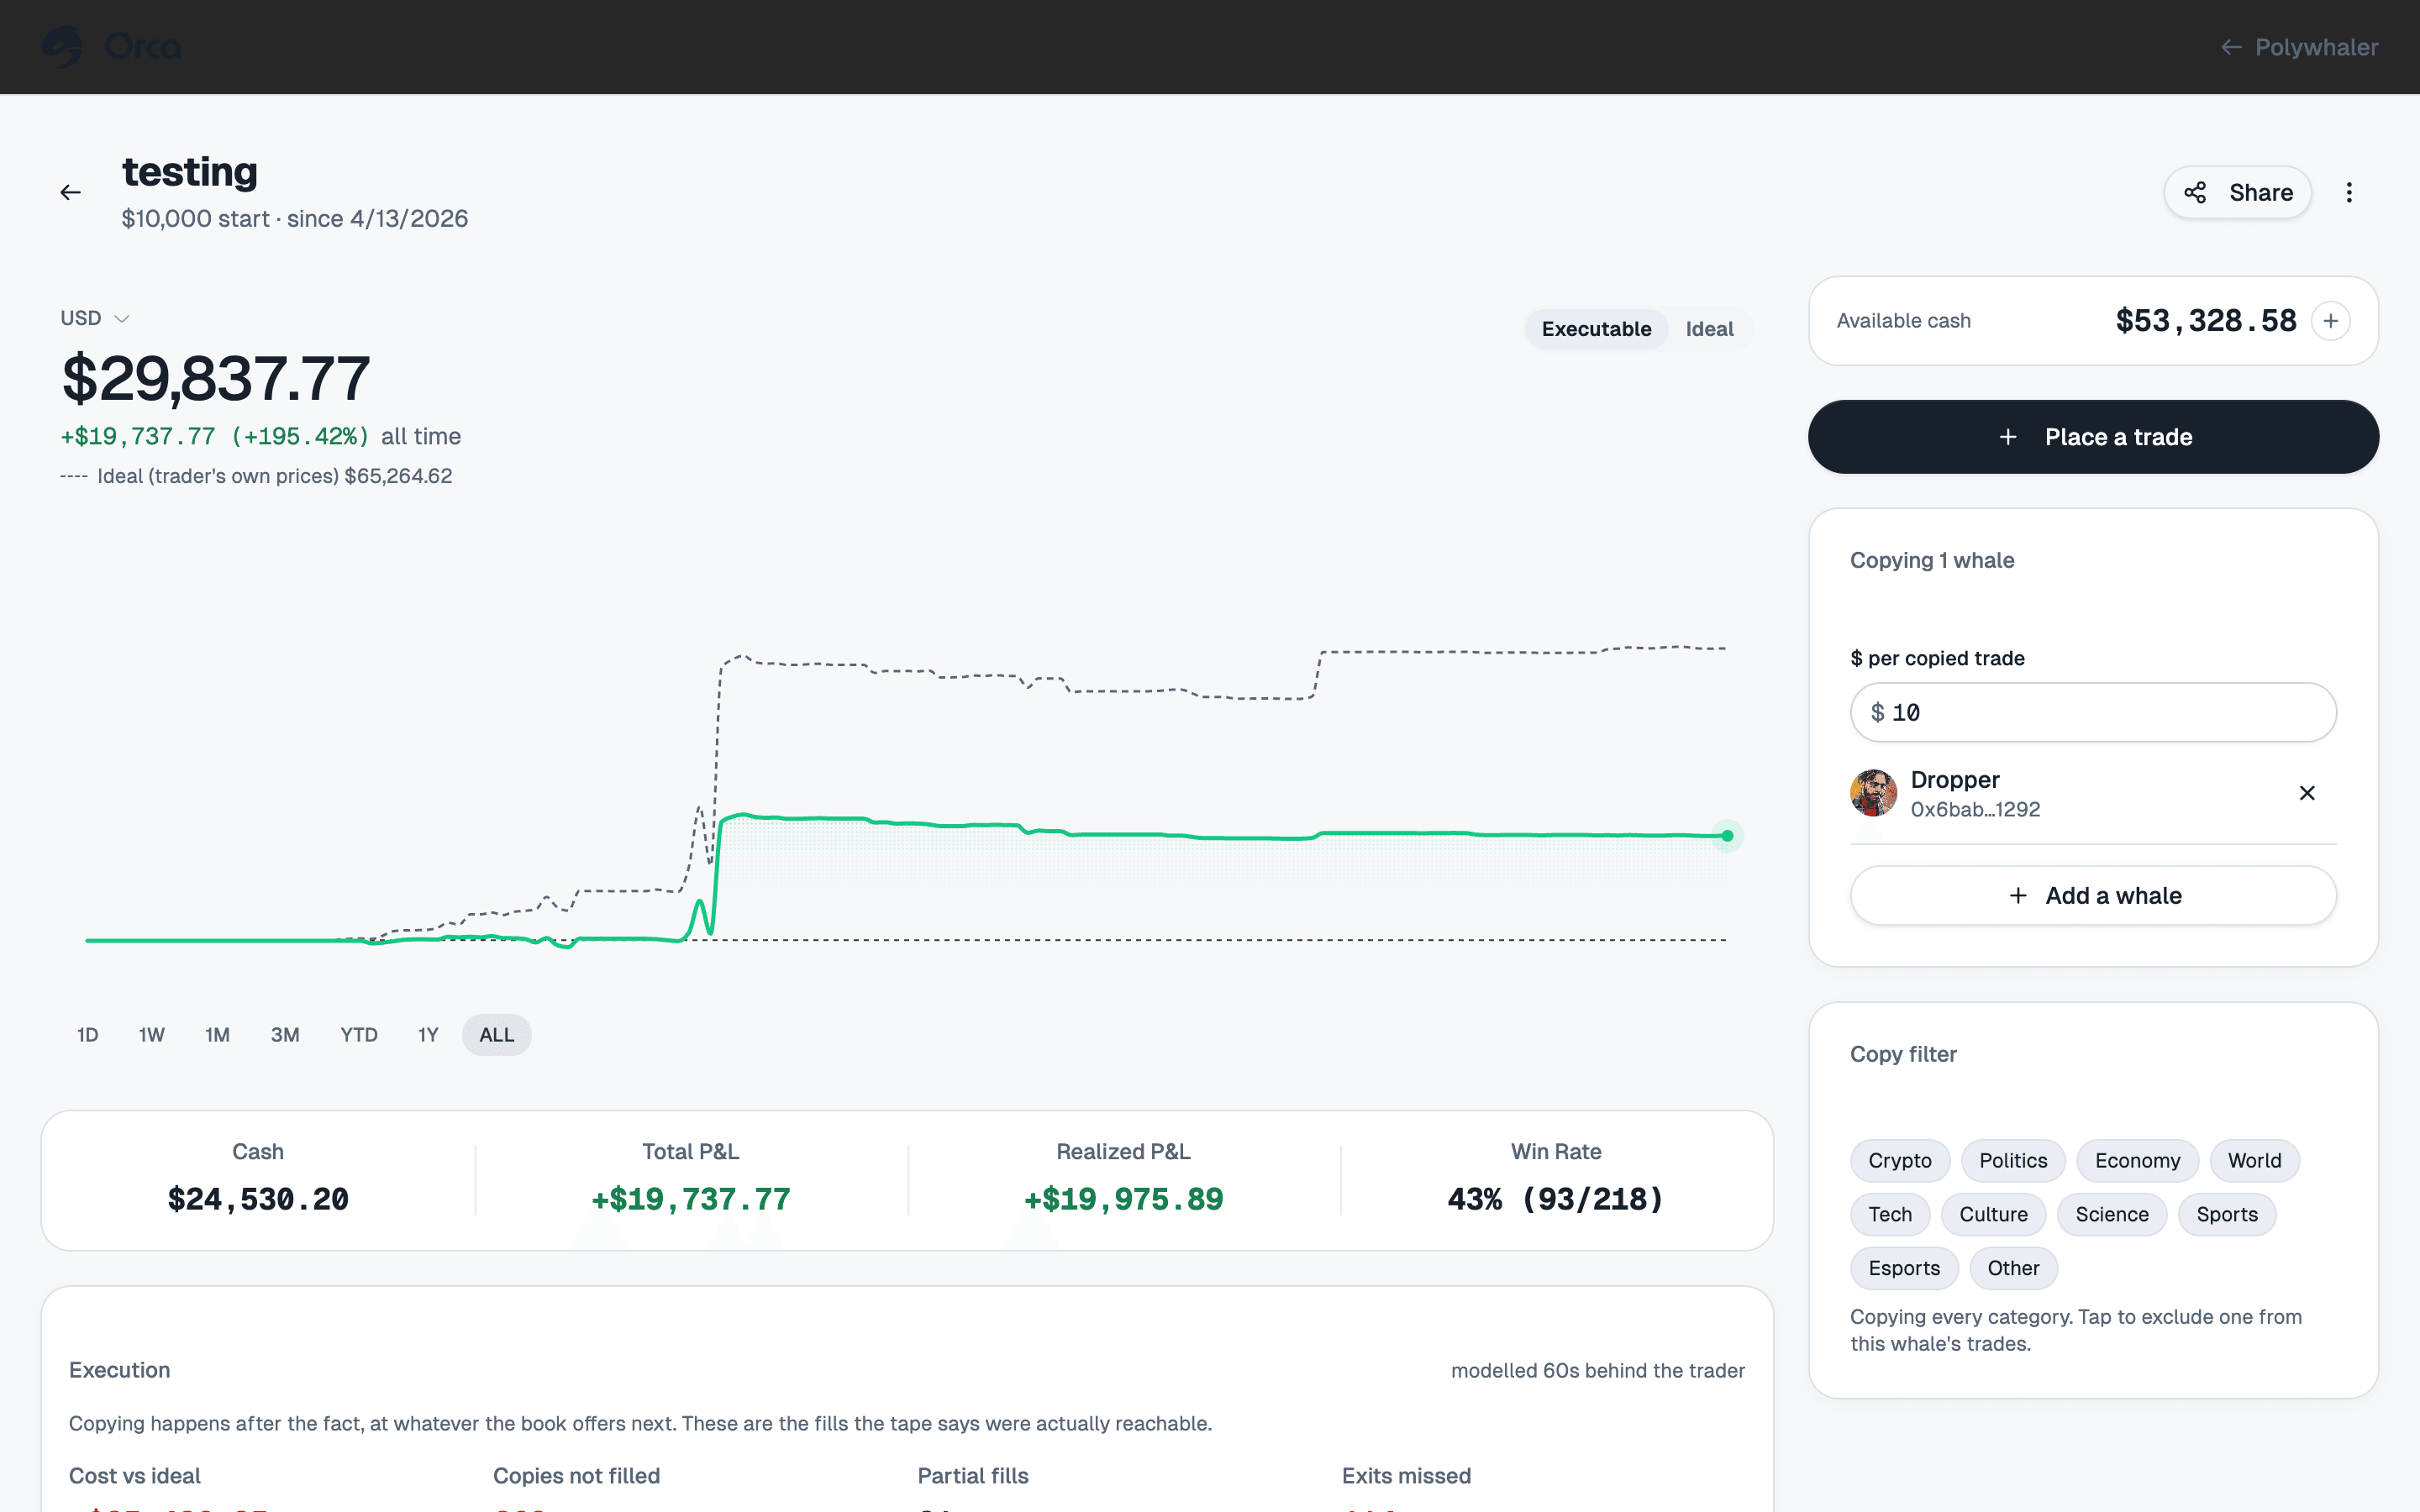
- Ideal: what the trader made. The right number for judging the trader.
- Executable: what following them could have made. The right number for judging the idea of following them.
The whole view switches at once, chart and statistics together, rather than mixing the two. An equity curve showing one and a win rate showing the other would be worse than either alone.
Tip
Why it is still an upper bound#
A print at a given price means a trade cleared there, so that price was reachable. Where the print was a maker fill, a taker copying it would have paid slightly worse. The model is therefore mildly optimistic, and that bias is deliberate: the executable numbers are a ceiling on what copying could have earned, not a promise.
Treat a portfolio that looks marginal in the executable view as worse than it looks, not better. If you are about to put money behind it, see auto-copy, whose slippage gate is the same idea applied in real time.